Land Misallocation and Industrial Development
– Prof. Kunal Dasgupta and Rahul Rao
Although a large share of land in India is used for cultivation, large tracts of this are unproductive and produce low crop yields. In this post, Dasgupta and Rao explain their calculations to determine the minimum amount of land that would be required to meet the outputs for a set of crops. They argue that optimising land allocation can release millions of hectares of land for non-agricultural purposes, while also ensuring that food security remains unaffected.
In several densely populated and economically backward countries, a majority of land is used in the agricultural sector1. This makes it difficult to acquire land for non-agricultural uses such as industrial development and urban expansion. A scarcity of land, then, becomes a constraint on industrialisation and urbanisation in these countries.
Consider India, where according to World Bank data, roughly 60% of total available land area was used for cultivation in 2018. India is a country where land acquisition is frequently cited as a major hurdle in the development of critical infrastructure2. Despite this, a popular position among Indian policymakers is that only land that is not currently being used for cultivation should be made available for industrialisation. Fertile land, it is argued, has many stakeholders with high opportunity costs (Ranganathan 2010). This argument, however, ignores the fact that in a developing country like India, large swathes of agriculturally unproductive land are also cultivated, often resulting in extremely low yields. This is clearly displayed in Table 1, which shows the average yields for rice and wheat in BRICS nations, a group including India, that are at comparable levels of development3.
Table 1. Yields of rice and wheat in BRICS countries, in tonnes per hectare (2014-18)

Source: UN Food and Agriculture Organization (FAO)
In our recent research (Dasgupta and Rao 2022), we ask the following question: how much land can be freed up for non-agricultural usage in India if agricultural land is allocated to its most optimal use?
Data on potential yields
To answer this question, we rely on a novel agronomic dataset that provides potential yields (a measure of land productivity) for a set of crops in millions of fields that span the entire earth. This data has been prepared under the Global Agro-Ecological Zones (GAEZ) project by the Food and gricultural Organization (FAO) and the International Institute for Applied Systems Analysis (IIASA).
GAEZ captures the following geographic attributes of each field that are important for agricultural production: soil quality, climate conditions, and terrain and topography. These ‘natural inputs’, along with different levels of ‘human inputs’ such as fertilisers, irrigation, and cultivation practices, are then fed into a state-of-the-art crop-specific agronomic model which calculates the potential yield for each crop in each field, not just for the ones which are being actually grown there. This potential yield is the maximum output that can be attained in a field for given levels of inputs.
We use the potential yields data to compute the minimum amount of land that a central planner would require to meet the actual output (at the district, state, or national level) for every crop, if land is allocated to crops optimally4. One could think of the planner as solving a two-stage problem. In the first stage, the planner chooses how much of each crop to produce. In the second stage, the planner chooses how much land to use for meeting the production targets calculated in the first stage. We implicitly assume that the first stage has already been solved for, and focus on the second stage.
In the empirical exercise, we assume that the planner (i) uses intermediate level of complementary inputs in all fields (that is, fertilisers and pesticides, but not heavy modern machinery), and (ii) has access to mixed water supply (that is, some regions are irrigated, and the rest perform rain-fed cultivation).
For the planner to achieve a reduction in total land usage, there must be variation in potential yield across fields for most, if not all, crops. For example, to reduce the amount of land required to grow wheat in a given district, the planner should be able to reallocate wheat production from fields with lower potential yield to those with higher potential yield. Table 2 shows the variation in potential yields at different administrative levels for the five largest crops in terms of land usage. As the table clearly displays, there exists substantial variation in the potential yield of all crops at each administrative level that could be exploited by the planner.
Table 2. Variation in potential yields (in tonnes per hectare) across fields
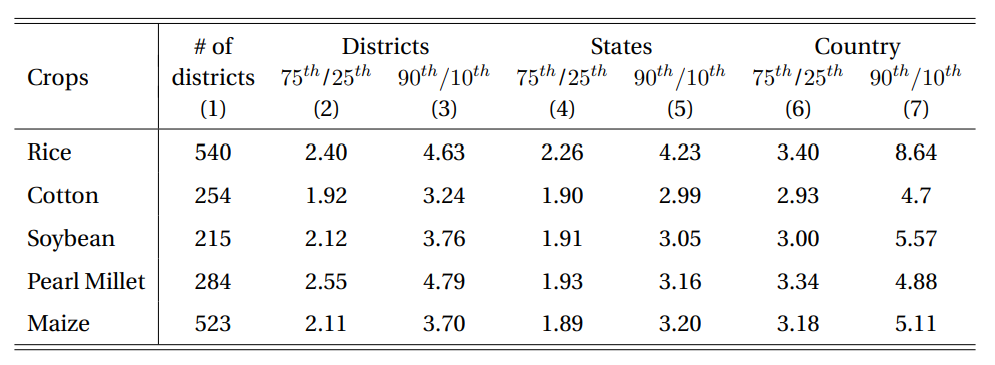
Source: GAEZ data set
Note: The table reports the mean value for the ratio of the 75th to 25th percentile potential yields in columns 2, 4 and 6 (across districts, states and at country-level respectively); and the ratio of the 90th to 10th percentile potential yields in columns 3, 5 and 7.
A measure of inefficiency
We calculate the inefficiency index of a district or state as the percentage difference between actual and optimal land usage – the higher this difference, the greater the inefficiency. Given that each GAEZ field is large (roughly 100 square kilometers, or 10,000 hectares), the possibility of potential yields varying even within a given field cannot be ruled out. Hence, we allow the planner access to parcels of 10 hectares within a field, where each parcel could be heterogeneous in terms of their potential yields. Additionally, we constrain the planner from using parts of certain fields because they are being used for residential or commercial purposes, or are covered by forests, water bodies, etc. – accounting for such negative selection reduces total available land area by almost 20%. Because the total area under cultivation is higher, as well as most crops’ yields are lower during the kharif season relative to the rabi season, we focus on the kharif season in our analysis.5
Our findings
We find that up to 25.2 million hectares (or 39%) of agricultural land can potentially be released across all districts in India if the planner optimises district-by-district. Figure 1 plots the inefficiency index for each district. If we sum up the actual and optimal areas at the state level and recalculate inefficiency, the state of Kerala turns out to be the most efficient; while the least efficient is Mizoram, followed by Himachal Pradesh.
Figure 1. Inefficiency across districts during kharif season

On the other hand, if the planner meets targets for actual production at the state-level, 36.8 million hectares (or 47% percent) can be freed up6 . Intuitively, moving from the district-level to the state-level eases the planner’s constraint in terms of which fields to cultivate. In this exercise, the state of Punjab is the most efficient, followed by Kerala; while Himachal Pradesh is the least efficient. Finally, if the planner meets production targets at the country-level, then up to 45.7 million hectares (or 57%) of land can be freed up.
What if freed-up land is reallocated to manufacturing?
The constrained optimisation problem that we have solved involves minimising the land required for producing a given amount of output. Freeing up agricultural land by reallocating it to its best use, however, is analogous to land-augmenting productivity improvement in the agricultural sector. We examine the welfare implications of such a productivity increase.
To do this, we develop a two-sector model where production is carried out in both sectors using land and labour. Both factors face mobility barriers: for labour, these could be barriers to physical mobility, while for land, these could be legal impediments to reallocating land from agricultural to non-agricultural usage. We calibrate the model using data from the agricultural and manufacturing sectors of India. Following an increase in agricultural productivity in the model, we find that (i) both land and labour move from agriculture to the manufacturing sector, (ii) land price declines while wage goes up, (iii) both agricultural and manufacturing output go up, (iv) agricultural prices go down, and (v) real income in the economy increases by 9.5%.
Here, a caveat is in order. While performing the reallocation exercise, we do not differentiate between a field in the hinterland and one near a major urban center7. One could argue that land that is well connected to existing production centers or markets is far more suitable for manufacturing. At the same time, apart from the fact that connectivity is endogenous, land close to locations with high population density also cost more, thereby increasing demand for land that is further away.
Conclusion
Our study shows that large tracts of unproductive land are used by Indian farmers, lowering crop yields. While the paper is about measuring the extent of misallocation, we can conjecture possible reasons behind this misallocation – lack of knowledge about suitability of land to grow certain crops; incentives to grow certain crops for which inputs such as seeds are readily available; and price distortions created by subsidies and minimum support prices which favour growing some crops over others could all contribute to suboptimal allocation of land.
It must be emphasised that in our exercise, the reallocation is carried out holding fixed the output of every crop. In other words, the exercise we perform keeps aggregate food security unaffected by construction. Nevertheless, we show that optimally assigning land to crops can reduce the total amount of land under cultivation by almost 40%.
How can the allocative inefficiency that we document above be corrected? That would surely require a robust and resilient policy framework. First, farmers need to be informed about the crops in which their farm has comparative advantage. In this context, the Soil Health Card scheme can be extended to report the pecking order of crops which have the highest productivity on a given farmland. Second, price incentives need to be aligned with potential yields. Favouring one set of crops over others results in both excess production of certain crops as well as low yields. Finally, a sound resettlement policy is warranted, whereby farmers are not only compensated fairly for their farmlands but are also provided the right training to be able to work in manufacturing.
Notes:
- According to World Bank data, during 2014-18, South Asia devoted around 56% of land in the agriculture sector, compared to 34% in the OECD countries and 25% in North America (Source: World Bank).
- According to (Mohanty et al. 2009), 70% percent of delays in infrastructure and other development projects were caused due to issues related to land acquisition.
- The BRICS grouping consists of Brazil, Russia, India, China, and South Africa.
- District and season-wise crop production statistics are compiled by the Directorate of Economics and Statistics of the Government of India.
- Kharif and rabi are the two main agricultural seasons in India. Kharif crops are grown at the onset of monsoon, while rabi crops are sown in winter and harvested in summer.
- For state and country-level exercises, we solve the planner’s problem at the field level. If solved at parcel level, the figures for freed-up land are higher.
- This is an extension that we intend to take up in future.
Further Reading
- Dasgupta, K and R Rao (2022), ‘Land Misallocation and Industrial Development‘, IIM Bangalore Research Paper No. 668.
- Mohanty, N, R Sarkar and A Pandey (2009), India Infrastructure Report 2009: Land – A Critical Resource for Infrastructure, 3iNetwork, Oxford University Press, New Delhi.
- Ranganathan, V (2010), “Challenges of Land Acquisition”, Economic and Political Weekly, 45(20): 39-41.
Source: Ideas for India